In 2016, the current 8th edition of API RP 941 was published including the then-new Nelson curve for non-post-weld heat treated (PWHT) carbon steel. Combined with several years of renewed industry and regulator attention on the high-temperature hydrogen attack (HTHA) damage mechanism, this new curve prompted owners across the downstream oil and gas, petrochemicals, fertilizer, and other industries to evaluate their assets for HTHA.
Sometimes referred to as ‘HTHA audits’ by those without a typical fear of the A-word, these “HTHA susceptibility reviews” were commonly performed at the unit level for piping and equipment and addressed the following:
- Normal and non-normal operating conditions in relation to the Nelson curve, usually with some owner-defined margin of safety applied (e.g. 50 psia and 50°F shift)
- Materials of construction, sometimes including verification via positive materials identification (PMI)
- Repair history including any possible non-PWHT repairs
- The potential consideration of other factors like cladding integrity, fabrication details, known excursions, etc.
- At times, the consideration of age or time in service
- Without industry-accepted time-dependent Nelson curves against which operating conditions could be compared, however, most of these reviews treated equipment of all ages similarly; regardless of whether the equipment in question was 10 years old, 50 years old, or more, only the API RP 941 Figure 1 curve (with a margin) was used for comparison.
In these reviews, significant numbers of assets were identified as potential concerns. Many of these were non-PWHT carbon steel which operated nominally at conditions below the previous Nelson curve for carbon steel (the “base metal or PWHT” carbon steel curve post-2016) but above the new non-PWHT curve. Reexamining assets where process conditions had changed over time, repairs had been made, PMI had identified material mix-ups, etc., resulted in additional findings. Where issues were identified, owners had the opportunity to use new NDE techniques (currently in API 941 Annex E but soon to be moved to API 586 section 2) to inspect for damage in addition to proprietary tools developed either in-house or by a joint industry project (JIP) to assess any damage or defects found (e.g., Equity Software’s PlantManager SAGE® HTHA module developed and improved by our JIP between 2015 and 2024).
Many materials engineers recognize the time-dependent nature of HTHA. Like creep, more severe conditions of temperature, stress, or (specific to HTHA) H2 partial pressure (H2PP) result in more rapid damage accumulation. API RP 941 has long provided “incubation” curves ranging from 100 hours at severe conditions of temperature and partial pressure, with severity decreasing– as the time span increases – down to the Figure 1 standard Nelson curve position (which did not have a time assigned to it). The time-dependent nature of HTHA at very long service times potentially below the current Nelson curve was not yet addressed. In acknowledgment of this limitation, the API 941 committee sponsored a project by the Welding Research Council, Inc. (WRC) for Equity Engineering to collaborate with Stress Engineering on developing time-dependent curves for average time to failure and lower-bound time to failure (“design”) as well as “credibility curves” for HTHA (conditions and times below which no amount of meaningful HTHA damage would be expected). These time-dependent curves were provided to API between 2021 and 2024. So that one set of time-dependent average time-to-failure curves could be provided, significant effort was exerted by this article’s author to merge and blend the curves from each model, including work to truncate and bound the curves for practical application. In addition, a different JIP that was not a part of the WRC project submitted curves generated by their model. API 941 committee leadership and task group members worked to blend the WRC and third-party time-dependent curves together into a single set of “design curves” discussed below.
It was found during this work (and subsequently corroborated by other organizations’ publications) that the 8th edition Figure 1 Nelson curve corresponds approximately to conditions that – when average material properties are assumed for CS, non-PWHT CS, and C-0.5Mo – result in HTHA failure after about 20 years. This duration is expected to be clarified for the Figure 1 curves for some materials in the anticipated 9th edition of API 941. The key takeaway is that >20-year-old equipment operating below the API 941 8th edition Nelson curves may still face substantial concern for HTHA. In light of the forthcoming 9th edition, operating companies should anticipate spending resources to assess equipment in potential HTHA service.
What do the time-dependent curves look like?
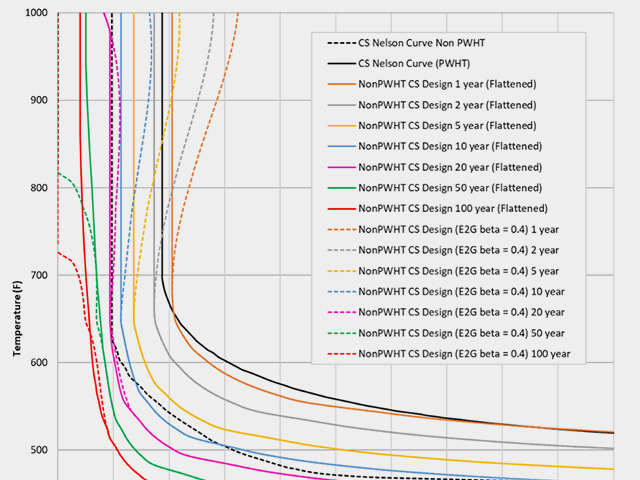
The time-dependent curves for average non-PWHT carbon steel properties (“failure curve”) and lower bound properties (“design curve”) from WRC’s final report to API for hydrogen pressures up to 500 psia are shown in Figures 1 and 2 below, respectively. Higher pressure ranges and equivalent curves for PWHT CS and C-0.5Mo alloy as well as the aforementioned credibility curves for all three materials are included in WRC’s formal report to the API 941 committee, which is available upon request.


What is the HTHA model behind the curves?
Some non-intuitive behavior of the design curves is apparent where both the final recommended curves (solid lines) and the preliminary (dotted line) curves are visible in Figure 2. Preliminary curves are those generated by the HTHA model without post-processing. Here are the relevant HTHA damage mechanism basics required to understand the shape of these curves:
- Hydrogen (H2) from the process adsorbs on the steel surface and becomes absorbed as atomic hydrogen (H).
- Atomic H reacts with carbides in the steel (Fe3C, Mo2C, etc.), converting them to metal and CH4 (methane).
- The methane molecule is too large to diffuse to the surface and becomes trapped at grain boundaries, where its pressure builds up until voids and micro-fissures form.
- Micro-fissures eventually coalesce into larger fissures and macroscopic cracks which progress through the pressure boundary.
- The necessary strength of common pressure vessel steels in moderate to elevated temperature applications is provided by carbides; this means the conversion of carbides to metal or ferrite (i.e., decarburization) also reduces the remaining matrix’s load-carrying capability.
Equity’s model is essentially a creep model except that Equity’s model also considers methane in addition to residual and applied stresses. Thus, (1) it is necessary to assume some applied stress, and (2) changes on conditions that affect the methane stress will affect the shape of the curves as generated by the model prior to post-processing.
For applied stress, it was assumed that the equipment is subject to an applied stress equal to the code allowable stress at the temperature stated. This is somewhat conservative; in reality, the applied stress is usually lower for most of the equipment shell due to corrosion allowance and both operating temperature and operating pressure being slightly below their design values (sometimes significantly below). However, this explains why the preliminary curves for HTHA intersect the y-axis, indicating failure after long service times at 0 psia of hydrogen. The culprit for this is just plain old creep – that is, a piece of equipment operating at 720°F and subject to the ASME Code (e.g., VIII-1) allowable stress for typical carbon steel (read as SA-516-70) at that temperature would reach the end of its useful creep life after 100 years, assuming average material properties and absent any HTHA damage. To avoid the impression that HTHA could occur at 0 psia, the API task group requested that WRC truncate the effects of creep alone at the low-to-zero H2PP range. Thus, rather than intersecting the y axis, the longer-time curves are vertical, and creep in the absence of H2 is evaluated using other methods like API 579 Part 10.
In regard to methane stress – while it may be counterintuitive, the equilibrium pressure that methane can reach (given an excess of reactant carbide and reactant H determined based on material solubility) actually decreases with increasing temperature above about 700°F. This is why the lower-duration curves curve to the right (higher H2PPs with higher temperatures). These are equilibrium calculations and HTHA is still expected to progress faster (kinetics) with higher temperatures. Practically, equipment designed to operate at 900°F and 100 psia H2 is likely to operate at temperatures slightly below 900°F, and must in any case heat up to and cool down from 900°F. Thus, it is logical not to take credit for any high-temperature thermodynamic effects that would push the curves to the right. Instead, any curves that trend to the right are truncated and made vertical.
How will the curves be presented by API?
While the WRC report to API included failure, design, and credibility curves, it is expected that the 9th edition of API 941 will only include the design curves. These will be provided in a new Annex H, both as a figure and as tabular and/or functional formats for calculation purposes. The rationale for including only the design curves is that API RP 941 is intended to be a design document for materials selection of new components. The 9th edition of that RP has completed committee balloting and is expected to be published this year. Evaluation of existing in-service equipment (nominally, fitness for service) would be addressed by API 579, which currently does not have guidance for assessing HTHA (neither calculating HTHA damage based on operating history, or assessing whether equipment with damage is acceptable for continued service). Equity SMEs are involved in ongoing work to help incorporate HTHA FFS guidance into API 579, with the goal to offer time-dependent curves as a simplified analysis “screening” tool, similar to the approach for Level 1 creep assessments achieved in Part 10.
How should the time-dependent curves be used to assess equipment?
For HTHA screening of equipment whose operation can be simplified in a single combination of temperature and H2PP, using the curves is straightforward. Based on the age of the asset, take the next-longest-duration curve (e.g., for an asset operated for 17 years, use the 20-year curves) and plot the operating conditions against the credibility, design, and failure curves.
- Below credibility curve: HTHA is not active; routine inspection and operating-condition tracking are usually not performed; periodically re-check conditions (e.g., after 10 years) for process creep.
- Between credibility and design curves: HTHA is active; regularly track temperature and H2PP, consider IOW limits and consider inspecting using HTHA NDE methods after half the design-curve time has been consumed, and consider a more detailed progression model.
- Between design and failure curves: Complete inspections for HTHA, establish and adhere to temperature and H2PP IOWs, and use operating data in a damage progression model to refine risk.
- Above failure curve: Perform detailed damage modeling (including potentially using time-dependent curves with a variable temperature operating basis as described below), inspect at regular intervals, and consider replacement instead of continued HTHA risk management.
For assets whose operating conditions cannot be easily simplified to a single temperature and H2PP, or where it is desired to use actual operating data (such as daily average temperature and H2PP), the use of the time-dependent curves becomes more difficult and is ultimately akin to using Robinson’s rule for creep damage summation. When several years of data are used in this manner, a few thousand rows of data will need to be analyzed and either H2PP or temperature (or both) may have significant variability.
The simplest case is when H2PP is relatively constant and in the relatively horizontal portion of the curves. Then the analyst can pick an appropriately conservative (e.g., 95th percentile) H2PP and simply run the temperature data through a histogram-fitting tool (built into any standard spreadsheet software). For fitting a histogram, the user must specify the “bins” as defined by their upper temperature limit, and these bins can be selected to conveniently match the temperatures of the time-dependent Nelson curves. The “life” for each bin is simply the time-dependent curve’s duration – either design (for inherent conservatism) or failure curve. The resulting relative frequency is scaled for the total time in service and divided by the bin’s life before all of the life fractions are summed. If the sum of life fractions is greater than 1.0, no more remaining HTHA life can be concluded, and more rigorous analysis is necessary.
More complexity emerges when the H2PP either varies significantly or sometimes appears in the vertical portion of the curves. In cases with extreme variance in H2PP values, a user must first sort their data by H2PP range, then construct a histogram in the same manner as above for each sub-set of H2PP before the life fractions can be summed. The logic is similar when H2PP is identified in the vertical curves, but an extra step ensures temperatures are not inadvertently grouped into bins with extremely high upper-temperature limits. Temperature bins are defined as above, starting with the curve of longest duration and working up; when a sufficiently short duration is reached wherein the H2PP is to the left of the pressure where that duration’s curve goes vertical, all the remaining data is lumped into the final bin at that H2PP. Then this bin’s relative frequency, operating time, and Robinson’s rule life fraction are calculated in the same manner.
As with any analysis, calculation effort should be balanced against excessive conservatism. A rigorous histogram effort for changing temperature and H2PP is unnecessary if the most severe conditions show remaining life when applied to the whole operating history. Conversely, an oversimplification which concludes > 100% of life consumed is similarly not useful.
What should owners do next?
The publication of API 941’s 9th edition marks a real shift in how HTHA susceptibility should be evaluated, and facility management should be notified now that resources will need to be allocated to re-assess existing assets against the new time-dependent curves. The natural starting point is the most recent HTHA assessment: any equipment that was flagged as borderline, or that was operating close to the Nelson curve with more than 20 years of service, deserves a fresh look under the new framework. From there, owners should begin assembling the operating data, PMI records, repair histories, and time-in-service documentation that a proper re-assessment will require, since gathering this information is often the longest step in the process.
Given the complexity involved in applying the curves correctly, particularly for equipment with variable operating conditions, Equity is available now to support both the preparation and execution of these assessments, as well as to perform detailed HTHA FFS evaluation for any assets that fail the time-dependent curve analysis. The window to get ahead of this change is open today; owners who act early will be far better positioned than those who wait until the 9th edition forces the issue.