Introduction
The term design by analysis (DBA) refers to leveraging advanced stress analysis methodologies to establish safe and efficient equipment designs. In 1963, Section III of the ASME Boiler and Pressure Vessel Code [1], introduced novel, codified pressure vessel design rules that utilized DBA. Subsequently, in 1968, ASME Section VIII, Division 2 (VIII-2) [2] adopted DBA concepts. The original DBA Code-based design rules were predicated on the idea that stresses throughout a pressure vessel component (based on all expected loading conditions) could be delineated and then characterized with respect to specific failure modes. Furthermore, based on this approach, conservatism associated with conventional design-by-rule (DBR) calculation methods could be realized and as such, the required safety factor could be reduced when performing DBA. To this end, safer and more efficient component designs could be achieved using DBA because detailed evaluation of actual stresses permits substituting knowledge of localized behavior. As such, assignment of more rational design margins can be accomplished using DBA techniques, in lieu of larger margins, which historically reflected a lack of knowledge and understanding.
DBA concepts not only endure today in pressure vessel design codes, but they also form the basis of Level 3 fitness-for-service (FFS) assessment techniques, as outlined in API 579-1/ASME FFS-1, Fitness-For-Service (API 579) [3]. This article is intended to offer a cursory overview of modern DBA approaches for pressure equipment designers, fabricators, engineers, and plant reliability personnel. Specifically, a high-level overview of procedures for providing protection against plastic collapse, local failure, buckling, and cyclic (fatigue) failure/ratcheting is offered herein. Additionally, commentary on how modern DBA techniques can favorably apply to both design (new construction) and FFS (in-service) scenarios is offered herein.
Protection Against Plastic Collapse
The failure mode of plastic collapse refers to gross structural failure due to unbounded plastic deformation under applied tensile loading (typically leading to ductile rupture). For pressure equipment, internal pressure often represents the governing loading scenario for plastic collapse. Additionally, the current edition of ASME Section VIII Division 2 [4] (consistent with API 579 [3]) provides three options for qualifying a vessel for protection against plastic collapse using detailed stress analysis. For in-service damage, general or local thinning (wall loss dues to corrosion or erosion) is often evaluated for protection against plastic collapse. As described in Reference [5], the first is elastic stress analysis; this methodology involves applying internal pressure and supplemental loads, calculating elastic stresses, classifying stresses appropriately through stress linearization, and using elastic stress limits to qualify a given design. Linear superposition can be employed when using elastic stress analysis because the method does not account for geometric or material non-linearity. Once stresses are linearized, they are characterized as either primary or secondary and delineated into equivalent stresses (based on distortion energy yield criterion or von Mises stress) that are membrane (average through a section), membrane plus bending (linear stress profile through wall), and peak stress [6]. Figure 1 summarizes the stress categories given in ASME VIII-2 [4] and provides the corresponding elastic stress limits. This figure is commonly known as the Hopper Diagram. Furthermore, this diagram is designed to illustrate stress categories and how they are combined. The term “Hopper” comes from the analogy of stresses being poured into the top of the diagram and subsequently categorized to be compared to prescribed limits.

In Figure 1, SPL denotes the limit on local primary and local primary membrane plus bending stress and is defined as the larger of 1.5 times the Code allowable stress at temperature or the yield strength (assuming the ratio of minimum yield strength to ultimate tensile strength does not exceed 0.70). Specifically, the following inequalities must be satisfied:


where PL denotes local primary membrane stress and PB denotes local primary bending stress. Furthermore, in Figure 1, SPS denotes the limit on primary plus secondary equivalent stress, required to satisfy protection against ratcheting (discussed further below), and is computed as the larger of three times the allowable stress at the average temperature over an operating cycle or two times the yield strength at the average temperature over an operating cycle (again, assuming the ratio of minimum yield strength to ultimate tensile strength does not exceed 0.70). Within the limits of reinforcement at nozzle neck-to-shell junctions, this limit applies to equivalent membrane plus bending stress from pressure, temperature, external loads, and moments, including those caused by restrained free end displacements of the attached pipe.
Finite element analysis (FEA) is a common computational stress analysis approach that is well suited for DBA techniques. Specifically, stresses from an FEA model can be delineated into three stress categories (primary, secondary, and peak), each with its own limits to address different failure modes. Furthermore, stress classification [6-8] and associated elastic limits are required to provide protection against plastic collapse and other failure modes as follows:
- Plastic Collapse – Primary Stress
- Local Distortion – Primary + Secondary Stress
- Cyclic (Fatigue) Failure – Primary + Secondary + Peak Stress
- Incremental Collapse/Ratcheting – Primary + Secondary Stress
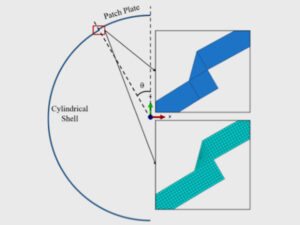
Stress classification can also be used to evaluate the propensity for brittle fracture, where through-wall stresses are used in a fracture mechanics calculation per Part 9 of API 579 [3]. The total stress at any location within a component can be calculated using FEA, where a through-wall elastic stress distribution can be extracted from the model. An example of this is shown in Figure 2. This figure shows an idealized nozzle-to-shell junction in a pressure vessel with a total through-wall stress distribution. By placing a stress classification line (SCL) at this location, the through-wall stress can be separated into the membrane component (average through-wall), the bending component (linear distribution through-wall that is maximum on one surface and minimum on the other surface), and the peak component (non-linear portion of stress local to the surface), as shown. Peak stress is often used in conventional fatigue calculations, but it can also be very sensitive to mesh refinement in an FEA model. Additionally, primary stresses are generally analogous to load-controlled scenarios (e.g., applied pressure, forces, or bending moments), and secondary stresses are relatable to displacement-controlled loads (e.g., metal temperature gradients/thermal stresses) [9].

The second DBA technique offered in the Code for satisfying requirements for protection against plastic collapse is limit load analysis. This alternative to elastic stress analysis employs elastic-perfectly plastic material properties and addresses the failure modes of ductile rupture and the onset of gross plastic deformation. Limit load analysis utilizes elastic-perfectly plastic material models strain-displacement relations that are consistent with small displacement theory (nonlinear geometric effects are not considered) and is also based on the assumption that equilibrium is satisfied in the undeformed configuration. Furthermore, displacements and strains achieved prior to non-convergence (achieving static equilibrium) have no physical meaning. For limit load analysis, a pseudo-yield value equal to 1.5 times the allowable stress at temperature is employed in the FEA and the maximum allowable load is established by taking 2/3 of the maximum load achieved directly prior to non-convergence. The term non-convergence in the context of this article denotes failure of the FEA model to achieve static equilibrium (typical solvers include Newton’s Method) under the prescribed loading and does not include the use of computational post-buckling techniques (such as Riks solvers) or stabilization schemes such as application of significant viscous damping.
The third methodology for evaluating protection against plastic collapse is elastic-plastic analysis, which involves incorporating an elastic-plastic material model (including strain hardening effects) into numerical analysis and accounting for geometric nonlinearity (large displacement theory). The allowable load for a given component is established by applying an appropriate design factor to the calculated collapse load, or the load that satisfies equilibrium prior to non-convergence (for all relevant load cases). The current design factors in Section VIII Division 2 for Class 1 and Class 2 vessels are 3.0 and 2.4, respectively (and 3.5 for recent editions of ASME Section VIII Division 1). Additionally, similar concepts for protection against plastic collapse can be applied to in-service equipment (including vessels, storage tanks, and piping components) where the margin applied to the collapse load corresponds to Table 1 as a function of the construction Code (consistent with API 579 [3]). Note that API 579 also permits users to apply a remaining strength factor (denoted RSFa in Table 1). An example of a three-dimensional FEA model of a complex pressure vessel is shown in Figure 3. In this case, contours of deformation (in inches) immediately prior to non-convergence are shown. This vessel was subject to internal pressure loading and supplemental nozzle loads. Note that displacements at the unfactored collapse load are not necessarily meaningful, although they can show the regions of the component that govern from a plastic collapse perspective.


Protection Against Local Failure
The intent of providing protection against local failure (e.g., the local strain check) is to evaluate areas of high triaxial stress that could be at risk for fracture or crack initiation [10]. There are two options available to analysts for this check: elastic and elastic-plastic analysis. The elastic approach has limitations, including the fact that it is not readily apparent or understood how pseudo-elastic stresses (elastically calculated stresses that exceed the yield strength) can be used to evaluate the local fracture strain of a ductile material with strain hardening. For this reason, the elastic-plastic local strain method is often recommended. As discussed in Reference [11], the local strain check is based on the concept that the allowable plastic strain at a point is a function of triaxiality in the component and the uniaxial strain limits for the material. The basis for the local strain check comes from hydrostatic stress relationships established by Bridgeman in the 1960s (see Reference [12]). The elastic-plastic local strain check takes the form:

The acceptance criterion for validating protection against local failure involves comparison of the calculated plastic strain plus forming strain versus a formulated triaxial strain limit (εL). Based on the FEA results obtained from equivalent static analysis (at a load factor of 1.7), the accumulated plastic strain is compared to this strain limit using a local strain ratio, where plastic strain at all points in the FEA model is divided by εL. Using this approach, if all points in the FEA model are below a strain ratio of 1, this triaxial strain limit is satisfied. This methodology is applicable to both new designs and in-service applications (e.g., Level 3 FFS assessments). More information on the local strain check is available in Reference [11], and material-specific constants are provided in ASME Section VIII Division 2 [4].
Protection Against Buckling
Buckling represents an instability type of failure when components are subject to a compressive stress field. A given component may have elastic or elastic-plastic compressive states of stress. Additionally, buckling is characterized by sudden failure of a structural member and occurs when a component converts membrane strain energy into bending strain energy without any change in the externally applied load. From an engineering standpoint, interesting phases of buckling occur before the deformations are very large; that is, when the structure appears to be only slightly deformed. Fundamentally, there are two phenomena associated with buckling failure. They are summarized as follows [13]:
- Bifurcation Buckling – The point of instability where there is a branch in the primary load versus displacement path for a structure.
- Reference configuration and buckled configuration are both possible equilibrium conditions.
- Equilibrium paths (primary and secondary) – either of two adjacent equilibrium paths are possible, the secondary path is known as the post-buckling path.
- Collapse – The sudden inability of a structure to carry loads, typically characterized as the maximum point on a load vs. deflection curve.
Additionally, ASME VIII-2 [4] (and API 579 [3]) offer analysts three options for evaluating buckling as follows:
- Type 1 – Bifurcation buckling analysis, linear elastic with small deformations, and imperfections are implicitly considered using capacity reduction factors.
- Type 2 – Bifurcation buckling analysis, effects of material non-linearity and non-linear geometry are included, and imperfections are implicitly considered using capacity reduction factors.
- Type 3 – Collapse analysis, note that the design factor accounted for in load factors corresponds to the tensile design margin, and imperfections are explicitly considered.
While not elucidated further herein, a summary of these buckling methods and their design margins is offered in Figure 4 (note that actual structures will follow a fundamental path OEF, where failure corresponds to “snap-through” at point E). This load vs. displacement behavior plot shows the general trend of decreasing conservatism moving from Type 1 to Type 3 assessment methods. Note that for FFS applications, the tensile design margin for Type 3 assessments will be a function of the original Code of construction (a factor of 2.4 is shown in Figure 4, which corresponds to VIII-2, Class 2 vessels). Additionally, an example of Type 1 buckling behavior (e.g., the first eigenvalue) for the complex pressure vessel shown in Figure 3 above is given in Figure 5. The loading in this case is external pressure (full vacuum).


Protection Against Cyclic Loading (Fatigue) and Ratcheting
Metal fatigue is a complicated metallurgical process that is cycle-dependent and in which failure of a component occurs due to repeated or cyclic loading, which creates cyclic stresses. Cyclic stresses can result from mechanical loading (applied loading or vibration) or thermal loading [9]. Furthermore, in metals, fatigue damage progression is characterized as developing from crack initiation (first at the microstructure level), to crack propagation (microcracks grow and link up to form macrocracks), and eventually to fracture of the remining ligament or cross-section of the component (failure). Figure 6 shows a simple schematic of this phenomenon as the number of equipment cycles increases.

Excluding wear and generalized corrosion, the most common source of failure in industrial structures is damage occurring at welds [15]. In the presence of variable thermal or mechanical loading over time (cyclic loading), plastic deformation occurs at the microscopic and macroscopic levels, which decreases the future ability of a welded structure to withstand stress and resist crack initiation [16]. As discussed in Reference [17], welded locations are notably prone to fatigue failures because welds often introduce residual stresses from the welding process and increased local stresses due to geometric discontinuities (stress concentrations) such as weld caps or welded attachment locations, often with fillet welds. As such, welds are often critical locations to carry out inspections to identify and characterize any fatigue-related crack-like flaws. For any fatigue assessment, it is necessary to accurately quantify the alternating stress range due to thermal and/or mechanical loads. Advanced FEA is often used to accomplish this (coupled with DBA techniques such as stress linearization), especially for complex geometries where resolving local stress distributions is crucial. Once stress ranges are determined, the next step to establish meaningful remaining life calculations is indexing calculated results to fatigue design curves based on test data with appropriate margins applied (e.g., S-N curves). Both ASME VIII-2 [4] and API 579 [3] offer several different methods for calculating fatigue life, including the ASME legacy smooth bar method and the more modern Battelle structural stress method.
Prior to implementation of the Battelle structural stress (welded fatigue) methodology (in the 2007 rewrite of ASME VIII-2), the legacy ASME smooth bar techniques [1,2] were the only option formally incorporated into the ASME B&PV Codes, and it still is an option for users today [3,4]. The smooth bar approach is based on small-scale smooth specimens, where fatigue curves for different material sets are provided. This method involves the use of fatigue strength reduction factors (FSRFs) to attempt to account for stress concentrations and other factors at welded locations (if the weld feature is not explicitly included in the analysis) [18]. Additionally, for elastic smooth bar analysis, a fatigue penalty factor intended to account for plasticity (denoted Ke) is used as a multiplier to increase the alternating stress. The Ke factor is known to be overly conservative, as discussed in Reference [19], and can be as high as 5 for elevated stress ranges. Furthermore, elastic-plastic smooth bar fatigue analysis is known to significantly reduce conservatism compared to the elastic approach, especially for high values of Ke. For reference, the ASME smooth bar fatigue curve for carbon and low-alloy steels (for ultimate tensile strength less than 80 ksi) is shown in Figure 7 (on log-log scales). This curve is valid for mean temperatures (over a given cycle) up to 700°F/371°C. The smooth bar fatigue curves reflect a design margin equal to either 2 on stress or 20 on cycles, whichever margin results in the lower number of cycles, with an adjustment for mean stress effects. These fatigue design curves are based on crack initiation.

The introduction of the Battelle structural stress methodology [20] affords the user the ability to incorporate fatigue predictions based on actual large-scale specimen welded fatigue tests. Additionally, this method is based on cycles to failure (not crack initiation). Furthermore, the comprehensive compilation of welded fatigue test data incorporated into the structural stress model is delineated based on confidence intervals. The welded fatigue tests span a wide range of joint geometries, plate, or pipe wall thicknesses, and loading modes with lives ranging from a few hundred cycles to nearly 108 cycles to failure. Based on a calculated equivalent structural stress parameter, this data is collapsed into a Master Curve that is characterized by statistical confidence intervals. The method is also robust, and it has been shown that it can be used with cumulative damage theories. Figure 8 shows the range of test data and associated confidence intervals (the equivalent structural stress range is plotted vs. cycles to failure). This figure provides some perspective on the scatter associated with welded test specimen results that form the basis of this methodology. Additionally, structural stress formulation provides fatigue predictions for specific confidence intervals ranging from -3σ to +3σ (σ denotes one standard deviation of the test data). The idea behind using confidence intervals to establish fatigue curves is to establish reasonable and conservative lower bounds to test data for use in equipment design and analysis. Each confidence interval is based on a certain probability of failure as follows:
- Mean Design Curve: 1/2 (50%)
- -1σ Design Curve: 16/100 (16%)
- -2σ Design Curve: 2/100 (2%)
- -3σ Design Curve: 1/1000 (0.1%)
ASME VIII-2 [4] states that -3σ design curve predictions shall be employed for design scenarios, and API 579 [3] directs users to utilize the -2σ design curve for FFS applications. API 579 removes some conservatism associated with the -3σ design curve by permitting the use of the -2σ curve for FFS assessments. The logic behind this assumption is to credit equipment for prior successful operation (in-service time). The mean design curve predictions, while not permitted for formal use in design or post-construction Codes, may be more appropriate to quantify or estimate the propensity for welded fatigue failure of in-service equipment. To this end, in-service component failures often reasonably align with the mean curve prediction. It is noted that API 579 offers users a Level 3 approach that is based on the Brown-Miller [21-23] strain-life model, which is an initiation-based failure model used to predict the onset of cracking. This method is only applicable for ductile materials dominated by fatigue failure due to shear cracking and not tensile cracking, as in brittle materials. Furthermore, this approach represents a mean prediction of failure and can be coupled with a critical plane approach [24].

Lastly, while not discussed in detail herein, quantifying protection against ratcheting is also required for components in cyclic service. Ratcheting is defined as progressive, incremental, inelastic deformation or strain that can occur in a component subjected to cyclic variations of mechanical stress, thermal stress, or both (thermal stress ratcheting is either partly or wholly caused by mechanical stress) [9]. Ratcheting is generally produced by a sustained load acting over the full cross-section of a component in combination with a strain-controlled cyclic load or temperature distribution that is alternately applied and removed. Furthermore, ratcheting causes cyclic straining of the material, which can result in failure by fatigue and produces cyclic incremental growth/deformation of a structure, which could ultimately lead to plastic collapse. API 579 [3] and ASME VIII-2 [4] provide methods to provide protection against ratcheting in design or in-service applications by using the results of an elastic stress analysis with the Bree diagram. This methodology ensures that shakedown to elastic action for membrane plus bending stresses will occur on any section through the wall of a pressurized component. Additionally, this procedure certifies that membrane plus bending plus peak stresses at the same section will result in a stabilized hysteresis loop.
In the 1950s, Miller [25,26] conducted an analytical investigation of a pressure vessel subjected to a through-wall cyclic thermal gradient. He assumed an elastic-perfectly plastic material model with a constant and uniform axial stress. In the 1960s, Bree [27] formalized the work of Miller and created a diagram that has become a widely accepted method to evaluate ratcheting. The Bree diagram plots the primary membrane stress vs. the cyclic thermal stress and delineates the various regions of plastic behavior. The following regions are included in the Bree diagram:
- E – Elastic cycling
- P1, P2, P3 – Plastic cycling
- S1 – Elastic cycling after initial one-sided plasticity (shakedown)
- S2 – Elastic cycling after initial two-sided plasticity (shakedown)
- R1 – Ratcheting, one-sided yielding
- R2 – Ratcheting, two-sided yielding
The original Bree diagram is reproduced and shown in Figure 9 (note that R = 1.0 where R is the ratio of the hot yield to cold yield strength [Sy]). The simplicity of the Bree diagram has led to its widespread adoption as an analysis tool by engineering practitioners; however, this has also led to its misapplication for certain problems outside the boundaries for which it was originally intended [28]. In 1981, Moreton and Ng [29] modified the original Bree diagram to account for cases with in-phase and out-of-phase cycling of the primary and thermal stresses. These revised Bree diagrams have recently been independently re-derived and republished in Reference [30,31]. In the refining industry, coke drums are known to experience ratcheting due to severe metal temperature gradients throughout a typical quench cycle.

Summary and Conclusions
DBA methods coupled with modern computational approaches such as FEA represent a critical engineering tool for evaluating the structural integrity of both new equipment designs and in-service equipment (subject to different damage mechanisms). Understanding all possible failure modes based on equipment operation and loading scenarios is essential. Then, the appropriate DBA techniques can be employed to optimize component designs while still maintaining safe equipment operation. Furthermore, modern DBA methods provide users with procedures for evaluating protection against plastic collapse, local failure, buckling, and cyclic loading (fatigue failure)/ratcheting. Both ASME VIII-2 [4] and API 579 [3] can be leveraged to evaluate new equipment designs and in-service components subject to degradation. Lastly, it is always recommended to utilize engineering resources sufficiently experienced in the nuances associated with detailed stress analysis (e.g., FEA) and DBA techniques. All computational simulations should be validated and thoroughly reviewed by subject matter experts to ensure the appropriate boundary conditions and material properties are implemented, and all analysis assumptions, results, conclusions, and recommendations should be documented in a detailed technical report for both new designs and in-service applications.
If you have any questions, please contact the author by submitting the form below:
References
- ASME, Boiler and Pressure Vessel Code, Section III, Nuclear Vessels. The American Society of Mechanical Engineers, New York. 1963.
- ASME, Boiler and Pressure Vessel Code, Section VIII Rules for Construction of Pressure Vessels, Division 2 Alternative Rules. The American Society of Mechanical Engineers, New York. 1968.
- API 579-1/ASME FFS-1, 2021, “Fitness-For-Service,” Fourth Edition, American Petroleum Institute and American Society of Mechanical Engineers, Washington DC/New York.
- ASME, Boiler and Pressure Vessel Code, Section VIII Rules for Construction of Pressure Vessels, Division 2 Alternative Rules. The American Society of Mechanical Engineers, New York. 2021.
- Prueter, P.E., Brown, R.G., “A Comparison of Design by Analysis Techniques for Evaluating Nozzle-to-Shell Junctions per ASME Section VIII Division 2,” PVP2015-45408, Proceedings of the 2015 ASME Pressure Vessels and Piping Conference, Boston, MA, July 19-23, 2015.
- Burgreen, D., Design Methods for Power Plant Structures. C.P. Press, New York. 1975.
- Kronke, W.C., Addicott, G.W., and Hinton, B.M., “Interpretation of Finite Element Stresses According to ASME Section III,” 2nd National Congress on Pressure Vessels and Piping. San Francisco, CA, The American Society of Mechanical Engineers, June 1975.
- Hechmer, J.L., and Hollinger, G.L., “WRC Bulletin 429: 3D Stress Criteria Guidelines for Application,” Welding Research Council, Shaker Heights, Ohio. 1998.
- Prueter, P.E., “Fatigue-Life Assessment,” Chapter 5 in Failure Analysis and Prevention, ASM Handbook Vol. 11. ASM International, Materials Park, OH, 2021.
- Prueter, P.E., and Kummari, S.R., “Evaluating Large Aboveground Storage Tanks Subject to Seismic Loading Part I: Closed-Form Solutions and Equivalent Static Analysis,” PVP2018-84836, Proceedings of the 2018 ASME Pressure Vessels and Piping Conference, Prague, Czech Republic, July 15-20, 2018.
- ASME, PTB-1: Section VIII Division 2 Criteria and Commentary. The American Society of Mechanical Engineers, New York. 2014.
- P.W. Bridgeman, Studies in Large Plastic Flow and Fracture with Special Emphasis on the Effects of Hydrostatic Stress. Harvard University press, Cambridge, Massachusetts. 1964.
- Bushnell, D., Computerized Buckling Analysis of Shells, Kluwer Academic Publishers, The Netherlands, 1989.
- Barsom, J.M. and Rolfe, S.T., “Fracture and Fatigue Control in Structures: Applications of Fracture Mechanics,” 3rd Edition, American Society for Testing and Materials (ASTM), West Conshohocken, PA, 1999.
- Price, J., Weld Cracking in Ferrous Alloys, Wood-head Publishing, UK, Editor: R. Singh, 2008.
- Radaj, D., Design and Analysis of Fatigue Resistant Welded Structures, Halsted Press, New York, 1990.
- Prueter, P.E. and Brown, R.G., “Applying ASME and British Standard Welded Fatigue Methodologies to Thermal Fatigue Case Studies and Investigating Sensitivity to Fatigue Flaw Growth Models,” PVP2015-45609, Proceedings of the 2015 ASME Pressure Vessels and Piping Conference, Boston, MA, July 19-23, 2015.
- Prueter, P.E., Bifano, M.F.P., Kummari, S.R., and Hantz, B.F., “A Comparative Study of the Thermal-Mechanical Behavior and Fatigue Life Predictions of Different Coke Drum Support Skirt Designs,” PVP2017-65807, Proceedings of the 2017 ASME Pressure Vessels and Piping Conference, Waikoloa, HI, July 16-20, 2017.
- Dewees, D. and Cooch, M., “Elastic-Plastic Fatigue Evaluation of a Heavy Wall Nozzle Subject to Rapid Thermal Transients,” PVP2012-78359, Proceedings of the 2012 ASME Pressure Vessels and Piping Conference, Toronto, Ontario, Canada, 2012.
- Dong, P., Hong, J., Osage, D., Dewees, D., and Prager, M., “Welding Research Council Bulletin 523: The Master S-N Curve Method: An Implementation for Fatigue Evaluation of Welded Components in the ASME B&PV Code, Section VIII, Division 2 and API 579-1/ASME FFS-1,” The Welding Research Council, Shaker Heights, OH, 2010.
- Brown, M.W. and Miller, K.J., “A Theory for Fatigue Under Multiaxial Stress-Strain Conditions,” Proceedings of the Institute of Mechanical Engineers, Vol. 187, pp.745-756, 1973.
- Brown, M.W. and Miller, K.J., “High Temperature Biaxial Fatigue of Two Steels,” Fatigue of Engineering Materials and Structures, Vol. 1 No. 2, pp.217-229, 1979.
- Brown, M.W. and Miller, K.J., “Two Decades of Progress in the Assessment of Multiaxial Low Cycle Fatigue Life,” Low-Cycle Fatigue and Life Prediction. Eds. Amzallag, C., Leis, B.N., and Rabbe, P., ASTM STP 770, American Society for Testing and Materials, West Conshohocken, PA, pp. 482-499, 1982.
- Socie, D.F. and Marquis, G.B., “Multiaxial Fatigue,” Society of Automotive Engineers, Inc. (SAE), Warrendale, PA, 2000.
- Miller, D.R., “Thermal-Stress Ratchet Mechanism in Pressure Vessels,” Knolls Atomic Power Laboratory, General Electric Corporation, Report KAPL-1955, Schenectady, New York, 1958.
- Miller, D.R., “Thermal-Stress Ratchet Mechanism in Pressure Vessels,” Journal of Basic Engineering, (Trans. ASME), Vol. 81, No. 2, pp. 190-196, 1959.
- Bree, J., “Elastic-Plastic Behaviour of Thin Tubes Subjected to Internal Pressure and Intermittent High-Heat Fluxes with Application to Fast-Nuclear-Reactor Fuel Elements,” J. Strain Anal. Eng. Des., Vol. 2, No. 3, pp. 226-238, 1967.
- Osage, D.A., Dong, P., and Spring, D., “Fatigue assessment of welded joints in API 579-1/ASME FFS-1 2016 – existing methods and new developments,” In the International Conference on Fatigue Design, Fatigue Design, 29-30, Senlis, France, November 2017, Procedia Engineering Vol. 213, pp. 497–538, 2018.
- Moreton, D.N. and Ng, H.W., “Extension and Verification of The Bree Diagram,” Struct. Mech. React. Technol., Vol. L, No. 10/2, pp. 8, 1981.
- Spring, D.W., Panzarella, C., and Osage, D.A., “Revisiting the Bree Diagram,” Proceedings of the 2016 ASME Pressure Vessels & Piping Conference, Vancouver, BC, Canada, July 17-21, 2016.
- Spring, D.W., Panzarella, C., and Osage, D.A., “WRC Bulletin 575: Revisiting the Bree Diagram: Derivation with Temperature Dependent Properties,” The Welding Research Council. Shaker Heights, Ohio. 2019.
- ASME, “PTB-1: ASME Section VIII Division 2 Criteria and Commentary,” The American Society of Mechanical Engineers, New York, 2014.