In Part 1, we introduced you to the new 3D visualization capabilities. Today, you’ll read about the reorganization and regrouping for data input and output, which will help you be more efficient.
Input
Data collected on the Input tabs is now regrouped and organized to reduce how many times you need to switch between tabs to view related data.
Analysis Control Tab
The Analysis Control tab now contains the configuration control keywords, calculation options, and all analysis control parameters. Plus, all items that can be toggled on and off are in one central location.
Vessel Information Tab
The new Vessel Information tab allows users to view multiple values at the same time, as the tab contains any type of design temperature, design pressure, joint efficiencies, and material. Previously, this information was contained in two separate tabs – Design and Material – which meant users had to click between the tabs and view only one value at a time.
Geometry Tab
Variable names are now located next to the geometry keywords. Typically, each SagePlus™ module handles multiple codes and Fitness-for-Service; the variable names do not always match the code, simply because there is no consistency across codes. To improve consistency, the SagePlus™ keyword naming convention now corresponds to the graphic on the right side of the screen.
Stiffening Rings
To review stiffening evaluations, users can now add standard shapes from the American Steel Standard (I-beams, L sections, etc.). Dimensions are now populated automatically, which reduces potential errors as the need for hand calculations is now eliminated. This new library is available for all modules except the AIF CSSP module.
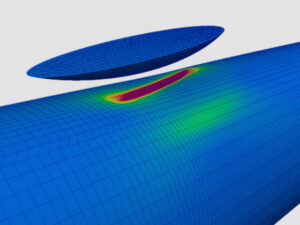
Real-Time Graphics
As covered in Part 1, real-time graphics are now available in every module. Users can view the graphics from a dockable window that can be placed anywhere on their desktop.
Output
Analysis Options Hide/Show
All analysis options (MAWP, required thickness, MAWT, MDMT, etc.) are now computed with every calculation rather than requiring a recalculation. Users can toggle each on and off. Note that if the calculations are turned off, only basic summary information will be shown.
Organization – Summary Tab
The Output tabs and Results have been reorganized like both the Input tabs and data. The Summary tab provides the acceptance criteria and whether they have been met based on the input conditions. The enhanced interface visually shows if all acceptance criteria have been met – acceptable criteria are green, and any unmet condition is red.
Additional tabs for each type of analysis performed are shown in the output. These tabs contain detailed information for each pass or fail condition. Click any hyperlink value from the Summary tab to access the Detailed tab. For example, if the user wants to see MAWP calculation details and the data for the resulting number, click the provided hyperlink to view a screen displaying both the loads and the results.