Design Code Modules – Calculation Reports
New calculation reports are now available within key SagePlus™ modules. We are continuing to add content to improve and expand calculation reports across the product. Most of the common design code components and some of the fitness-for-service calculations will be supported in the next release with the goal of 100% coverage for these calculations in the subsequent release.
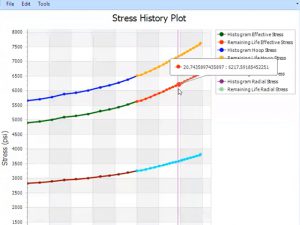
A calculation report is formatted as if it’s an example problem, but all the presented data is for the user’s specific problem. To run a calculation report, first select the desired equation type. Complete all relevant input information and populate the report. As the report process runs, upfront calculations or intermediate dynamic geometry pertaining to the data the user inputs are completed. Acceptance criteria is included with a pass/fail grading. Equations and the parameters factored into acceptance criteria are also provided.

Custom Import/Export Reports
Users can now create customized reports of imported and exported information. Import/export reports are general data reports used for inspection and can be configured to include only selected content sections. Available configurations include:
- Table of contents
- An executive summary, which is essentially the Summary Tab showing pass/fail results
- All input information
- Detailed calculation results
- Supplemental load cases
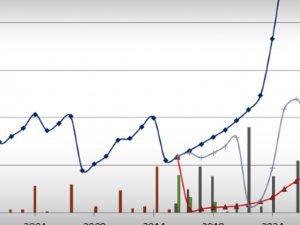
- Trend graphs including accuracy, size, and quality (impacts file size)
- Symbols and keywords
By default, an import/export report includes all available input and output data. The dialog box associated with this report enables users to control how a report is generated, such as by selecting graph size and quality, file format to be generated (PDF, Word, or text file types), and options (e.g., print keywords, print symbols, table of contents). The default report generates a table of contents with the first and second levels of output items. The user can add or remove these output items or reorder them within the dialog box. In the final report, the listings in the table of contents are hyperlinked for quick access to each section of the report. To populate the report, click Save As and choose the location for the file to be saved.

Straight Output
The original report option of a straight output of data into a text file remains an available report option.
Attend the First-Ever SagePlusTM User Group Meeting!
This block contains unexpected or invalid content.Attempt Block Recovery
Learn about the latest SagePlus™ updates and future development plans
Share your feedback on how to improve SagePlus™
Connect with other industry professionals, in person or virtually